

Real-time monitoring and process flow control
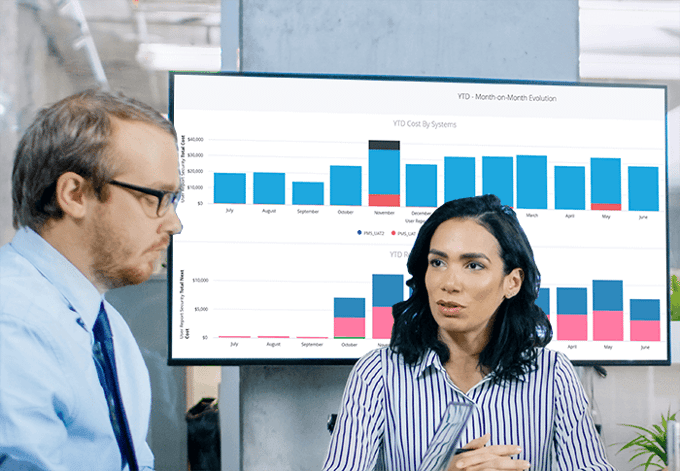
Xprocess is our fully managed, adaptive business process monitoring platform. It offers real-time visibility on business processes, allowing for highly efficient decision making based on factual data.
If you are looking to increase business resilience, accountability and transparency, then Xprocess is the perfect solution for you.
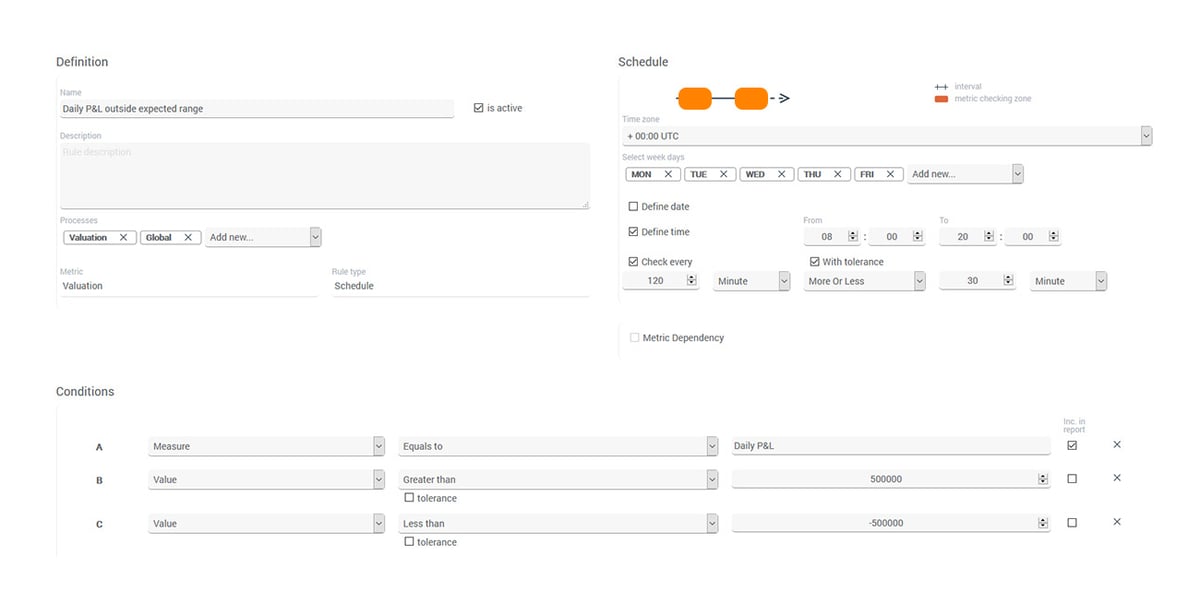
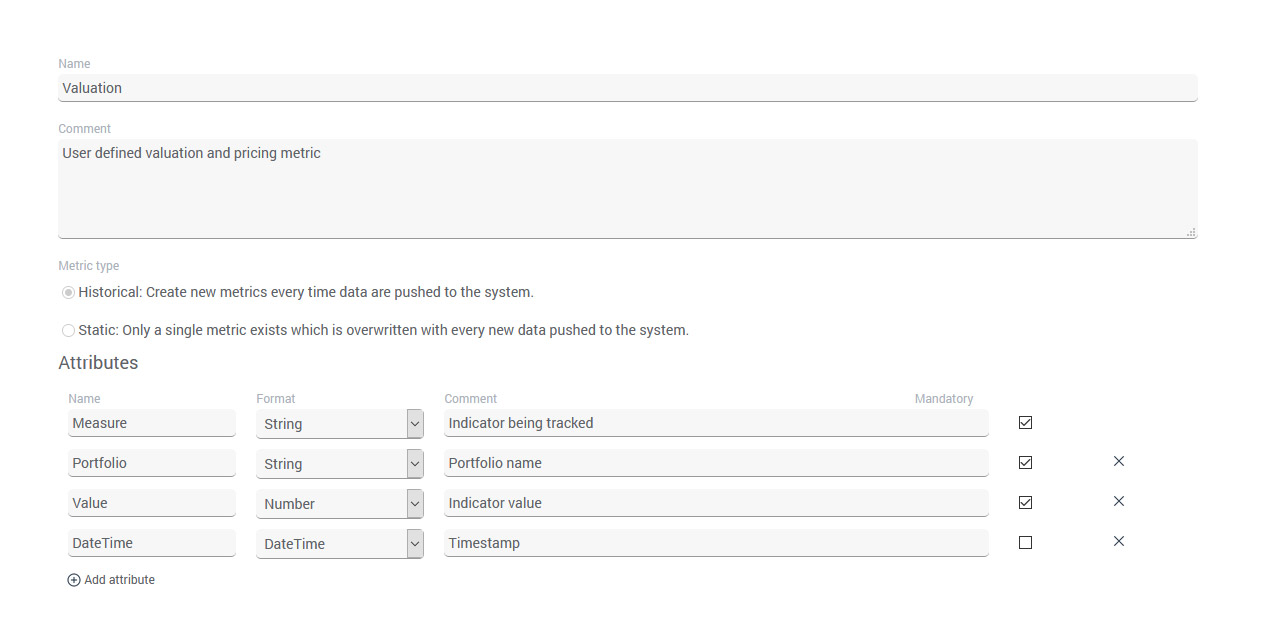
Xprocess allows your to model and track data-related business processes and provide round-the-clock transparency, resilience and stability.

Xprocess delivers real-time business monitoring for data-driven decision making.