Complete control over reference data usage with Xmon
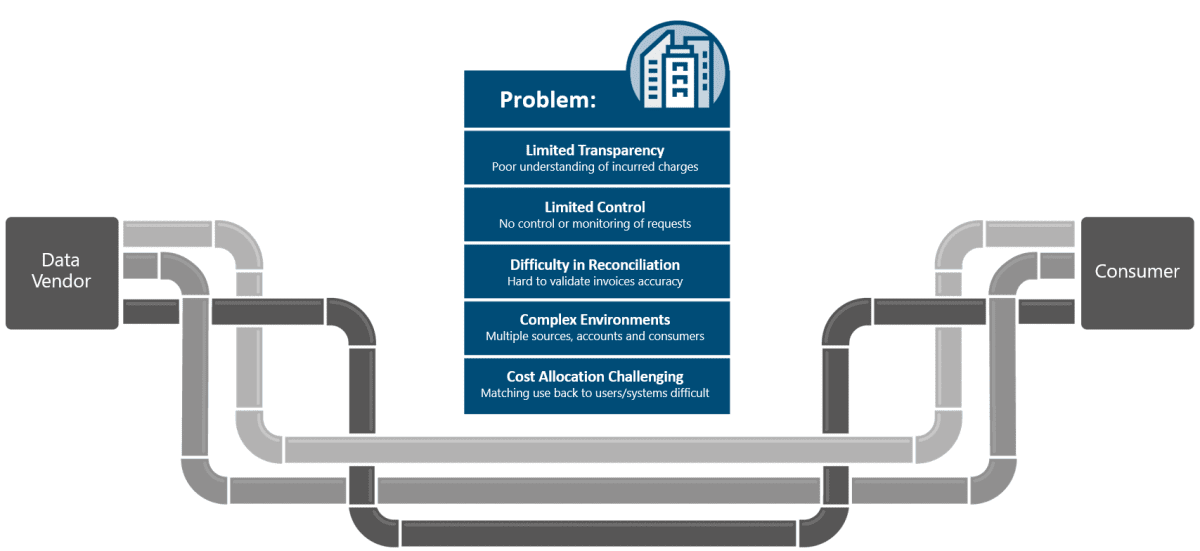
Managing reference data from different vendors, with several contracts and multiple internal consumers is challenging. Reference data is costly, vendor commercials are difficult to model and access to data is subject to compliance and regulatory requirements. Xmon addresses these challenges.
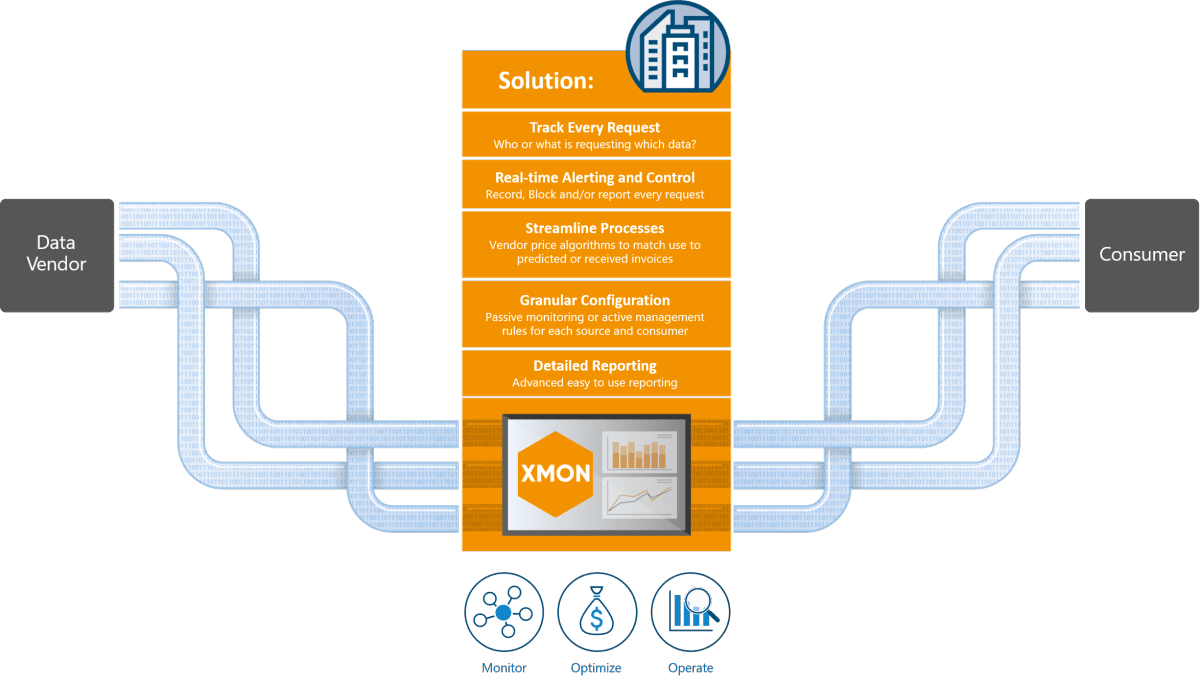
Xmon is a SaaS delivery focusing on reference data usage management, business process monitoring and reference data connectivity. It empowers your Market Data team with the tools they require to manage reference data usage in an agile and cost-effective way.