Derive monthly insights using XMon automated reports
Why monthly invoices are not enough
Invoices received from vendors on a monthly basis provide an a summary of the month’s spend and costs but are limited to current month’s spend. If you’re looking to get a better understanding, control and governance over reference data usage, you’ll need more analytics, especially relative indicators to quickly compare against last month’s usage and identify sources of usage spikes.
Three metrics to look for in a monthly reference data analytics report:
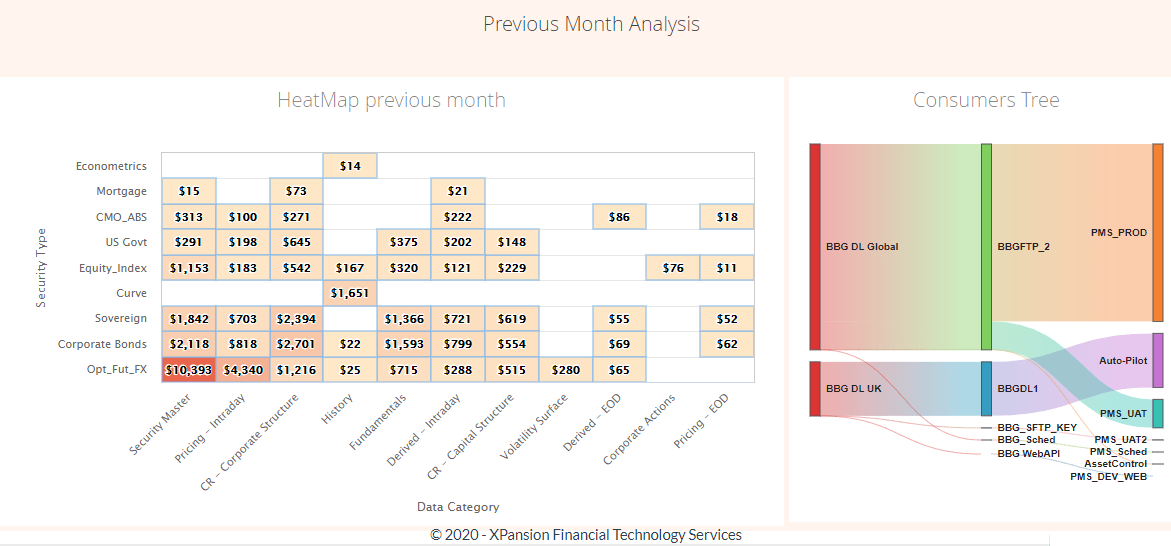
- Data consumer allocation for the current period, in comparison to last month: this helps determine whether specific consumers have changed their data consumption behaviour during the current period.
- Data category allocation: this allows data operations teams to understand whether new data categories have been requested during the current month that have not been used before.
- Asset class allocation: this helps data teams manage understand whether any new asset classes have been accessed during the period and any asset classes that have no longer been used.
Simplifying access to data analytics
Over the last few weeks our BA team has been working on simplifying customer access to monthly analytics and have built automated, simple to understand reports that provide usage insights, showcasing the above three metrics in a synthesized and easy to access format. These reports are sent automatically by XMon, straight to your team’s inbox.
The XMon Monthly Review report is sent automatically at every end of month and graphically displays usage trends, relative indicators and allocation by consumer, data category and asset class for a comprehensive review of data usage as well as a clear comparison with last months utilisation. The screenshot below shows a comparison data category consumption:

The above example indicates a nearly 50% increase in Historical data spend, while Pricing usage has declined slightly. Data category classification, coupled with other metrics, such as consumer and asset class allocation also available in the report, allow your data operations teams to better understand usage and derive actionable insights based on your firm’s usage patterns.
Xmon Insights and tailored recommendations
Using the monthly report, you’ll be able to trigger more detailed business intelligence extracts from XMon to drive usage optimisations. For example, to understand how a data category’s trends have evolved over the period, simply generate the field analysis report (STD12) and obtain a deeper understanding of the underlying reasons for increasing trends, in minutes. Using the field analysis report you’ll also be able to identify the actions that can be put in place to mitigate the increased utilisation.
If you’re a client subscribed to Xmon Insights, you will get the added benefit of a more detailed analysis, run by our team of experts, and monthly tailored recommendations to optimise your spend.
Contact us for more information about Xmon Insights or for more details about how your firm could benefit from better data usage analytics.