Did your team inflate the data bill?

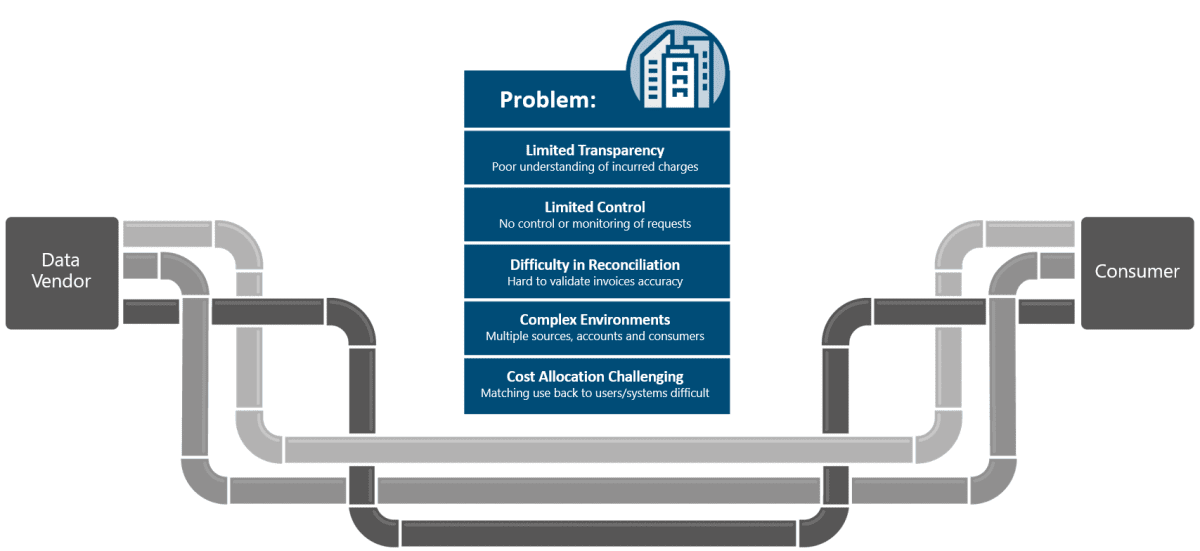
When management come inquiring about data bills, you need to have an answer. But if all you’ve got is an overview of your company’s aggregate data costs how can you tell for sure what was the impact of the teams, environments or systems you administer?

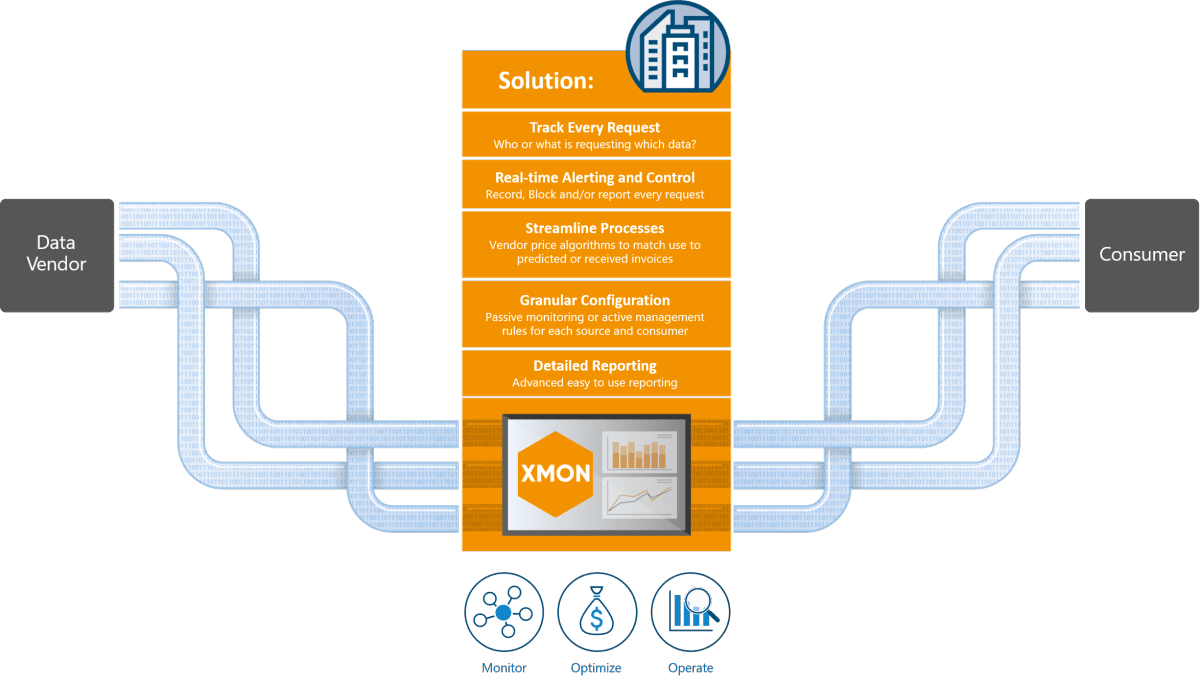
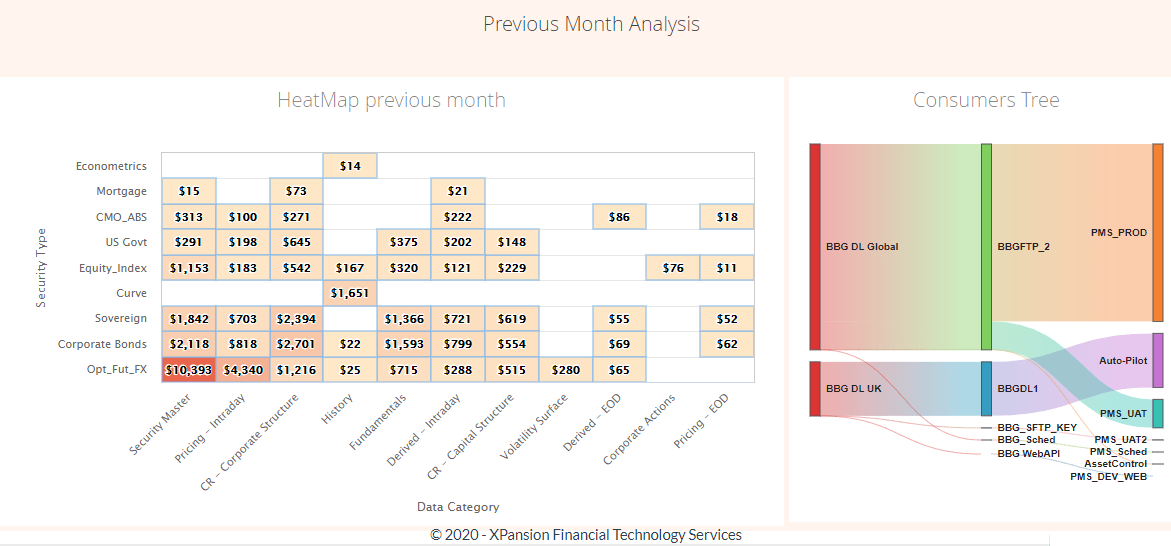
By splitting up data spending and slicing it into different segments of usage, XMon can help you determine precisely what each team, system or environment’s contribution to the cost is, and whether that usage was too high, lower than usual or as expected – Based on real data usage and in real-time.

Model your systems

Modelling your system landscape in XMon is straightforward, but it begins with understanding your business’s cost allocation methodology. Once this is established, use XMon to build a map of systems requesting static data with their corresponding data vendors, and assign tags to them based on how costs will be allocated internally.

Build your reportsstats

With the system landscape modelled and tags assigned, accessing detailed cost allocation information is just a click away. With XMon, you can re-generate vendor invoices, compare monthly spending, build cost allocation reports find top spenders and much more. So, when your bosses ask, you’ll have answers – but why wait for them to come to you? XMon reports can be scheduled and sent out on a regular basis to relevant people so that up-to-date information is always available, straight in their inbox.

Quantify your impact

Whether the data invoice has increased due to normal business growth, or whether you’ve made savings through internal optimizations or using the XMon Rule Engine, keeping stakeholders -and yourself- in the know about how data is being consumed is key to keeping market data spending under control. Get in touch to see the above in action or to request an XMon evaluation for your organization.